kWh And kW On Bills
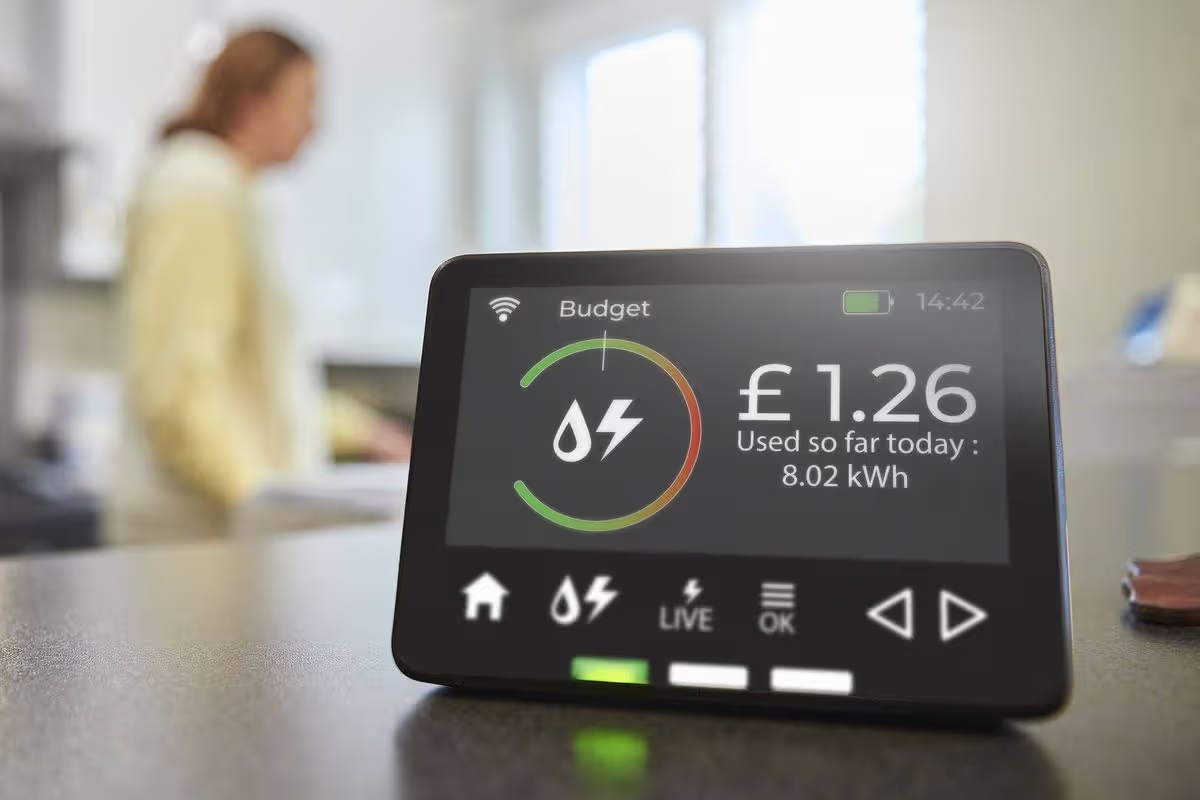
Energy bills usually show both kWh and kW, even when the meter itself records power continuously. kWh measures how much electricity you used over time, while kW measures how fast you used it at a specific moment or over an interval. A smart meter can report both, but the billing system decides which values become charges.
For a practical example, a space heater rated at 1.5 kW running for 3 hours uses about 4.5 kWh. The “rate” you see on the bill is usually tied to kWh, while kW shows up when utilities price demand or show peak usage. If your bill includes a “peak demand” line, the kW number matters more than the kWh total for that line item.
Some utilities also publish interval data in 15-minute or hourly blocks. That means the meter’s kW values are often averages over the interval, not a single instantaneous reading. This detail matters when you compare “peak” values across months, because the averaging window changes what counts as a peak.
Common Meter Data Confusions
People often treat kW and kWh as interchangeable, then wonder why their math does not match the bill. kW is a rate, so multiplying kW by hours produces kWh. Without the time component, a kW number cannot tell you how much energy you consumed.
Another frequent confusion comes from how smart meters report demand. Many systems compute demand from interval data using a defined method such as “highest average kW over the billing period” or “highest 15-minute average.” If your utility uses a sliding window or a specific averaging rule, the peak kW you see on a portal may not match the highest single interval you can spot manually.
Time-of-use pricing adds another layer. When rates differ by hour or season, the same kWh total can cost more or less depending on when it occurred. Interval data helps, but only if you map each interval to the correct tariff period. A bill that shows only a monthly kWh total hides that timing effect.
Supporting technologies also shape what you see. Smart meters rely on metering hardware, communications networks, and a billing database that may aggregate or resample data. If the portal shows “estimated” reads for a period, the kWh totals may be adjusted later, which can make comparisons look inconsistent. I have seen this in utility portals where the data label includes a version tag like “v2.3” for the same month, which usually means the back-end recalculated something.
How To Read Your Bill
Match Units To Charges
Start by listing every line item on your bill and tagging it to a unit. Energy charges are typically based on kWh, while demand charges (when present) are based on kW peaks or averages. If your bill has a “delivery” section, it may include both an energy component and a demand component.
Then do a quick consistency check. If your bill says you used 450 kWh in a month and your average daily usage is shown, dividing 450 by the number of days should land near the daily figure. If it does not, the bill may include partial periods, estimated reads, or adjustments. Those differences are common around meter swaps or billing-cycle changes.
Use Interval Data For Timing
If your utility offers interval data, download it and compare it to your tariff schedule. Many providers publish 15-minute or hourly usage, which corresponds to average kW over each interval. For example, if an interval shows 2.0 kW for 15 minutes, that interval energy is about 0.5 kWh. This is the bridge between the two units.
When you analyze peaks, use the same definition your utility uses. If the tariff defines demand as “highest 15-minute average kW,” you should compute the highest 15-minute average from the interval series. A common mistake is to take the highest single sample when the portal already averaged it, or to compare a 1-hour peak to a 15-minute demand rule.
Tools can help here. A spreadsheet or a small script can compute interval energy and identify peaks, but the key is matching the interval length. I once debugged a mismatch caused by a user exporting data in local time while the portal displayed it in UTC; the peak shifted by one interval and the kW looked “wrong” even though the underlying meter data was consistent.
Watch For Demand Charges
If your bill includes demand charges, treat kW as a cost driver even when kWh stays stable. Demand charges often respond to short periods of high load such as HVAC cycling, EV charging, or water heating. A household can reduce kWh slightly yet still pay a high demand charge if the peak remains.
Practical steps depend on your load profile. If you can shift flexible loads, schedule EV charging or laundry to off-peak hours and avoid stacking multiple high-draw appliances. If you cannot shift, you can still reduce peak by staggering start times or using lower power settings on devices that support them. The outcome is usually a lower peak kW, not a dramatic change in monthly kWh.
Interpret kW Portals Carefully
Some portals show “current kW” or “last hour kW,” which can mislead if you treat it as a billing number. Billing demand is typically based on a defined interval and a defined period, not on whatever the portal shows at the moment you log in.
Look for labels such as “average,” “max,” “interval,” or “demand.” If the portal provides a data dictionary, use it. If it does not, compare the portal’s peak kW to the bill’s demand line across one billing cycle; the match often reveals the averaging window. On one utility site I reviewed in 2024, the portal’s “Max Demand” matched the bill only after filtering to the same tariff months, which was not obvious from the interface.
Educational Case Examples
Scenario 1: Time-of-use pricing without demand charges. A tenant uses 520 kWh in a month. The bill shows a higher cost than expected because most usage occurred during peak hours. Interval data reveals that weekday evenings account for a disproportionate share of kWh, even though the monthly total is similar to the prior month. The tenant shifts dishwasher and laundry to late night for two weeks and sees the peak-hour kWh drop, which lowers the energy charge even if total kWh changes only modestly.
Scenario 2: Demand charge driven by EV charging. A homeowner’s monthly kWh is stable, but the bill includes a demand charge based on the highest 15-minute average kW. Interval data shows a consistent spike when EV charging starts while HVAC is also running. Staggering EV charging to start 45 minutes later reduces the highest 15-minute average kW. The kWh total changes little, yet the demand line drops because the billing peak kW changed.
kWh Vs kW Quick Guide
| What You See | Unit | What It Means | How It Affects Bills |
|---|---|---|---|
| Energy use over a month | kWh | Total electricity consumed over time | Usually drives energy charges |
| Average load in an interval | kW | Rate of use averaged over a defined interval | Used for demand calculations when present |
| Peak demand value | kW | Highest demand metric defined by the tariff | Can drive demand charges even if kWh is steady |
| Time-of-use allocation | kWh by time block | Energy assigned to peak/off-peak hours | Changes cost when rates differ by hour |
Quick conversion for interval data: if you know the average kW for a 15-minute interval, you can estimate the interval kWh by multiplying by 0.25 hours. This matches how many billing systems translate interval demand into energy totals, though the exact method can vary by utility.
Practical Mistakes To Avoid
One common error is comparing a “current kW” display to a monthly bill. Current kW reflects a moment or a short window, while bills usually use defined intervals and billing periods. Another error is ignoring time zones and daylight saving time when you export interval data; a one-hour shift can move peaks into a different tariff block.
People also overfit to a single spike. A demand charge depends on the tariff’s demand definition, so you need to check whether the spike is the highest average over the required interval length. If your portal shows “max demand” but you compute “max kW” from raw samples, the numbers can diverge because the portal may already average or filter the data.
Finally, avoid assuming that every number on a portal is final. Some utilities revise interval data after meter events, communications gaps, or back-end corrections. If you compare a bill to a portal screenshot from a different date, you may chase a discrepancy that later disappears.
FAQ
Is kW or kWh used for bills?
Most energy charges use kWh, while demand charges (when your tariff includes them) use kW based on a defined peak or average over a set interval.
Why does my peak kW not match my bill?
Billing demand often uses a specific averaging window (such as highest 15-minute average) and a defined tariff period; the portal view may use a different definition or time filtering.
How do I convert interval kW to kWh?
Multiply the average kW for each interval by the interval length in hours. For example, 2.0 kW over 15 minutes corresponds to about 0.5 kWh.
Do time-of-use rates change kWh totals?
Time-of-use rates change the cost allocation of the same kWh across peak and off-peak hours; the meter still measures energy, but the tariff assigns different prices to different times.
Can smart meters estimate usage?
Some utilities may use estimates when communications fail or during certain meter events, then later replace them with actual reads; bill and portal values can differ until corrections settle.
Author's Insight
kWh and kW describe different dimensions of electricity use: energy over time versus power as a rate. Smart meters can report both, but billing systems apply tariff rules that define which kW metric becomes a demand charge and which kWh blocks become energy charges. The most reliable approach is to map each bill line item to its unit and then test your interpretation using interval data and the tariff’s interval length. If the portal lacks a data dictionary, comparing one billing cycle’s demand and energy totals to your computed values often reveals the averaging and time-block rules.
Key Takeaways
- kWh tracks total electricity used; kW tracks how fast electricity was used over a defined interval.
- Energy charges usually follow kWh, while demand charges follow a kW peak or average defined by your tariff.
- Interval data bridges the units: average kW over an interval converts to kWh using the interval length in hours.
- Time-of-use tariffs change cost by hour, so identical monthly kWh can still produce different bills.
- Portal “current” values often do not match billing metrics; use the bill’s definitions and the tariff’s interval rules.