U-Value And R-Value
U-value and R-value both describe thermal resistance, but they use opposite directions. R-value measures how strongly a material or assembly resists heat flow, while U-value measures how much heat passes through per unit area for a given temperature difference. In practice, a higher R-value usually corresponds to a lower U-value for the same construction, because resistance and heat transfer move in opposite directions.
For example, a wall build-up with more insulation thickness tends to slow heat movement, so it raises resistance and lowers the U-value. The confusing part is that product labels may show either metric, and different regions and standards prefer different conventions. If you compare windows, roofs, and walls, you also need to check whether the number refers to a single material layer or the whole assembly including air films and framing.
On a typical energy-efficiency label, U-values are often reported in W/m²·K, while R-values are frequently shown in imperial units like ft²·°F·h/Btu. Converting between them is possible, but the conversion depends on units and whether the value is for a material layer or a complete assembly.
Common Misreads And Traps
People often treat U-value and R-value as interchangeable, then compare numbers that describe different things. A material R-value for insulation boards does not match an assembly U-value for a wall that includes studs, sheathing, and thermal bridging. Thermal bridging matters because wood and metal framing conduct heat faster than insulation, and the “average” performance can be much worse than the insulation layer alone.
Another frequent mistake is ignoring the boundary conditions used in the calculation. U-values depend on the temperature difference across the assembly and on how surface resistances (inside and outside air films) are handled. If one source includes those surface resistances and another does not, the numbers can shift even when the insulation thickness looks identical.
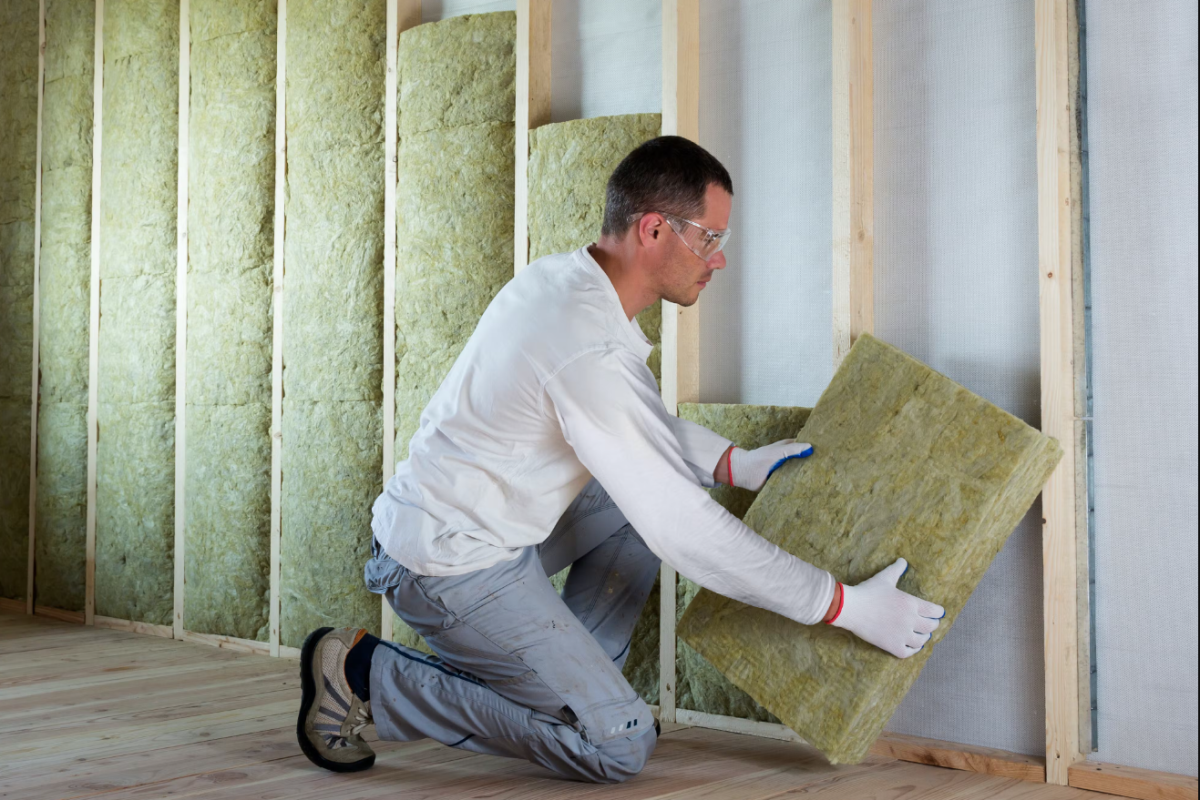
Installation quality changes the real-world result. Gaps around batt edges, compressed blanket insulation, poorly sealed penetrations, and missing air barriers can create air leakage paths that bypass the insulation. In those cases, the measured heat loss reflects both conduction through the assembly and uncontrolled air movement, and the label metric alone cannot predict the outcome.
Supporting technologies also influence performance. Air sealing products, tapes, membranes, and window glazing systems affect the effective heat transfer path. A house with good insulation but leaky ductwork or poorly sealed rim joists can still lose heat quickly, which makes the U-value vs R-value comparison feel “wrong” even when the math is consistent.
How To Compare Numbers
Check Assembly Scope
Start by identifying whether the value is for a material layer or for the whole assembly. Insulation batts might list an R-value per thickness, while a wall system might list a U-value for the complete wall. When you compare products, compare like with like: either all assemblies using U-values, or all layers using R-values, then convert carefully if needed.
A practical method is to look for a spec sheet that states the tested or calculated build-up. If the sheet lists a full wall section with stud size, spacing, and insulation thickness, the U-value is more comparable across vendors. If it only lists insulation material properties, you still need to model the framing fraction and thermal bridging, which many homeowners skip.
As a side observation, I’ve seen product PDFs where the R-value is given for a specific thickness at a specific mean temperature, and the thickness is not the one sold in the box. That mismatch is small on paper and annoying in the attic.
Use Consistent Units
U-values are commonly expressed in W/m²·K, while R-values are often in ft²·°F·h/Btu. Conversions are possible, but you must confirm the units and whether the value includes surface resistances. If you convert a layer R-value into an assembly U-value without adding air films and accounting for framing, the result can look precise and still be misleading.
For decision support, many homeowners avoid conversion by comparing in the same metric used by their local energy code or energy model. In the United States, energy software and code compliance often use R-values for assemblies, while some international contexts use U-values. If you use an energy calculator, follow its input format rather than forcing a manual conversion.
As a minor detail, some spreadsheets label the conversion factor as “approximate” and then quietly assume standard air film resistances. That assumption can shift the final number enough to matter when you’re comparing two close options.
Account For Thermal Bridging
Thermal bridging reduces effective performance, especially in stud walls and around structural members. A wall with high insulation R-value can still have a higher U-value than expected if metal studs, concrete, or poorly insulated edges dominate the heat flow path. You can reduce bridging by using continuous exterior insulation, insulated sheathing systems, or thermal break details around structural elements.
Realistic outcomes depend on the starting point. Moving from a “mostly cavity” insulation approach to a “continuous layer” approach often lowers the effective U-value of a wall because it reduces the fraction of heat that travels through framing. The magnitude varies by climate, framing spacing, and insulation thickness, so the best practice is to use a build-up calculator or the manufacturer’s system-level data.
When you see a wall U-value that looks dramatically better than the insulation layer alone, that improvement usually comes from accounting for bridging and air films, not from magic thickness.
Verify With Practical Checks
Numbers on paper do not replace installation verification. Use a checklist for air sealing and insulation continuity: seal rim joists, insulate and air-seal duct boots, cover penetrations, and maintain the designed insulation depth without compression. For attics, confirm that the insulation reaches the eaves and that baffles are installed where required for ventilation.
For measurement, a blower-door test can quantify air leakage, which strongly affects heating and cooling loads. Infrared thermography can reveal missing insulation or air leaks, though it depends on outdoor temperature and indoor conditions to interpret correctly. If you’re comparing two retrofit options, measure before and after air sealing rather than relying on insulation labels alone.
As an aside, I’ve watched people chase a higher R-value in the attic while leaving a large gap around a plumbing chase. The blower door results made the “better insulation” look irrelevant, which is frustrating but educational.
Case Examples For Real Homes
Wall Upgrade With Framing
A homeowner in a cold climate replaces cavity insulation in a 2x6 stud wall. The insulation product has an R-value per inch that looks high, but the wall still feels drafty near outlets and along the baseboard. The homeowner adds air sealing at penetrations and installs a continuous exterior insulation layer. The measured improvement comes from both reduced air leakage and reduced thermal bridging, so the effective U-value drops more than the cavity insulation change alone would suggest.
In this scenario, the key lesson is that the insulation layer R-value does not predict the whole-wall U-value when framing and air leakage dominate. The homeowner’s next step is to compare whole-assembly U-values from a build-up model or system spec sheet, then verify air sealing with a blower-door test if feasible.
Attic Insulation And Air Leakage
A renter adds attic insulation on top of existing material. The bag label shows an R-value per thickness, and the homeowner reaches the target depth. Heat loss still seems high because the attic hatch is leaky and ductwork joints are unsealed. After sealing the hatch and sealing duct connections, the home’s heating demand drops, even though the insulation thickness stays the same.
This example shows why U-value vs R-value comparisons can fail when air movement bypasses conduction. The next step is to treat air sealing as part of the insulation system, then reassess performance using utility bills or a calibrated energy model.
U-Value Vs R-Value Checklist
| What You’re Comparing | Use This Metric | What To Verify On Labels | Common Pitfall |
|---|---|---|---|
| Insulation material layer | R-value per thickness | Thickness, temperature basis, and whether it’s for dry conditions | Assuming it equals whole-wall performance |
| Whole wall, roof, or floor | U-value for the assembly | Build-up details, framing/bridging assumptions, and air film inclusion | Comparing assemblies with different framing fractions |
| Retrofit planning | Either metric, if consistent | Inputs match your energy model or code path | Converting without matching assumptions |
| Real performance | Air leakage + insulation continuity | Sealing details, penetrations, and duct connections | Chasing R-value while ignoring air sealing |
Step-by-step checklist for buying or planning insulation:
- Write down the exact assembly you have now (wall type, stud size, spacing, roof build-up, attic ventilation approach).
- Collect label data that matches the assembly scope: whole-assembly U-values or layer R-values with thickness.
- Confirm units and basis (W/m²·K vs ft²·°F·h/Btu, and whether surface resistances are included).
- Model thermal bridging if you’re comparing stud walls or mixed materials; otherwise, compare whole-assembly data from the same build-up.
- Plan air sealing and penetration sealing as part of the insulation work, then verify with blower-door testing if possible.
- After installation, compare utility bills over a similar weather period or use a calibrated energy model to avoid “season noise.”
Common Mistakes To Avoid
One mistake is comparing a window U-value to a wall U-value and treating the difference as a measure of “how good” the entire building envelope is. Windows also involve solar heat gain and different construction layers, so the comparison can mislead. Another mistake is using a single R-value number for a whole attic without accounting for air leakage at the hatch, recessed lights, or duct penetrations.
People also misread “aged” or “design” values. Some insulation products list a thermal performance under specific conditions, and the value can change with moisture content or long-term settling for certain materials. If a spec sheet references a test standard or a version date, record it; a change in test method can shift the reported number.
Finally, many retrofits fail because they ignore moisture management. Adding insulation without maintaining proper ventilation or without using the correct air barrier strategy can raise condensation risk in cold climates. The right next step is to follow local building guidance and the manufacturer’s installation instructions for vapor control and air sealing layers.
FAQ
Which Metric Matters More?
Whole-assembly U-values matter for comparing complete walls, roofs, and floors, while layer R-values matter for comparing insulation products at a given thickness. For retrofit decisions, use the metric your energy model or code pathway expects.
Can I Convert R-Value To U-Value?
You can convert between R and U only when you match units and know whether the value includes surface resistances and represents a layer or an assembly. Conversions that ignore air films and framing assumptions often produce numbers that look precise but do not match real performance.
Why Does Framing Change The Result?
Framing conducts heat faster than insulation, so it lowers the effective resistance of a wall assembly. Whole-assembly U-values typically account for framing fractions, while insulation-layer R-values do not.
Do Air Leaks Affect U-Value?
Air leakage creates heat loss through uncontrolled airflow, which is not captured by conduction-only U-value or insulation-layer R-value. Blower-door testing and air sealing target this separate heat-loss pathway.
What Should I Look For On Labels?
Confirm the scope (layer vs assembly), units (W/m²·K or ft²·°F·h/Btu), thickness basis, and any stated test standard. If the spec sheet lists assumptions about temperature or moisture, record them because they affect real-world performance.
Author's Insight
U-value and R-value describe the same physical idea—how heat moves through building assemblies—but they report it from different angles. The most reliable comparisons come from whole-assembly data that includes air films and thermal bridging, then from installation details that prevent gaps and bypasses. When homeowners compare only insulation-layer R-values, the framing fraction and air leakage often dominate the outcome. A practical approach is to match the metric to the decision tool you use, then verify the retrofit with air sealing checks and, when feasible, blower-door measurements.
Key Takeaways
- R-value measures resistance; U-value measures heat flow through an assembly, so higher R usually means lower U for the same build-up.
- Compare like with like: insulation layers use R-values, while walls/roofs/floors often use whole-assembly U-values.
- Thermal bridging and air leakage frequently outweigh insulation-layer differences, especially in stud walls and around penetrations.
- Use consistent units and matching assumptions, then verify installation quality with air sealing checks and measurements when possible.