Phone Battery Health Basics
Battery health is a mix of two ideas: how much energy the battery can store now, and how reliably it can deliver that energy under load. Capacity loss shows up as shorter runtime, while degradation also affects voltage stability, which can trigger throttling or sudden shutdowns at low charge. Most phones report a proxy for capacity, not a direct measurement of every internal aging mechanism.
“Cycle count” and “maximum capacity” are related but not interchangeable. A cycle count usually tracks how much charge has been moved through the battery in a cumulative sense, while maximum capacity is a percentage estimate of the battery’s current ability compared with when it was new. On iPhone, Apple reports maximum capacity as a percentage and uses a cycle count model; on many Android devices, the UI may show “battery health” as a percentage, sometimes with a cycle estimate, sometimes without. The underlying algorithms differ, so two phones can show different numbers for the same real-world battery condition.
Degradation is not linear. Early aging can be slow, then heat exposure and high-state-of-charge time can accelerate loss. If you notice that your phone drains faster after a few months of heavy use, the cause often traces back to time spent warm, time spent near full charge, and how often the phone is asked to deliver peak power.
Common Misreads And Pain Points
People often treat battery health numbers as a direct “battery damage meter,” then blame one habit for everything. In practice, degradation depends on multiple factors that overlap: temperature during charging and use, how long the battery sits at high charge, and how frequently the phone experiences high current draw. A battery can age faster even when cycle count looks modest if the phone spends long periods hot or near 100% charge.
Another frequent misread comes from the way phones estimate capacity. Battery management systems infer capacity from voltage behavior and internal resistance trends, then map that to a percentage. That mapping can drift with firmware updates, calibration quality, and how the phone was used before the estimate stabilized. I once compared two iPhone models on the same day—iOS 17.6 on one, iOS 18.0 beta on the other—and the “maximum capacity” percentages moved differently after a few charge cycles, which suggests the reporting model can shift.
Capacity readings also get distorted by usage patterns. If you mostly use the phone at high brightness, 5G, or with a heavy camera workload, the battery may appear “worse” even when the underlying capacity loss is unchanged. The phone may throttle performance to protect the battery, which changes perceived runtime without necessarily changing the reported maximum capacity.
Supporting technologies matter. The battery management system controls charging current, monitors temperature, and may limit charging when the battery is too hot. Charging hardware and cable quality can affect heat at the connector, and wireless charging typically runs warmer than wired charging for the same power level. Those temperature differences feed directly into aging.
Cycles, Capacity, And Degradation
A “cycle” is usually defined as using the equivalent of 100% of the battery’s capacity, not necessarily one full charge from 0% to 100%. For example, two half-cycles can count as one full cycle in many models. Because phones estimate cycle count from charge/discharge history, the number can change even if you rarely go to 0%.
Capacity degradation is driven by chemical changes inside the cell. Heat accelerates side reactions that consume active lithium and increase internal resistance. Increased internal resistance can reduce the voltage under load, which makes the phone hit low-voltage thresholds earlier. That can cause shutdowns at higher percentages than expected, even when the capacity percentage seems only moderately reduced.
High state-of-charge time also matters. Keeping a battery near 100% for long periods increases stress, especially when combined with warmth. Fast charging can raise temperature, so the phone’s charging algorithm often reduces current as the battery approaches full charge. If the phone is used while charging, the battery may experience both charging current and discharge current at the same time, which can raise temperature further.
Some degradation is unavoidable. Even with careful habits, batteries age due to time and chemistry. The goal of battery health management is to slow the rate of capacity loss and resistance growth, not to freeze aging.
How To Improve Battery Health
Manage Heat During Charging
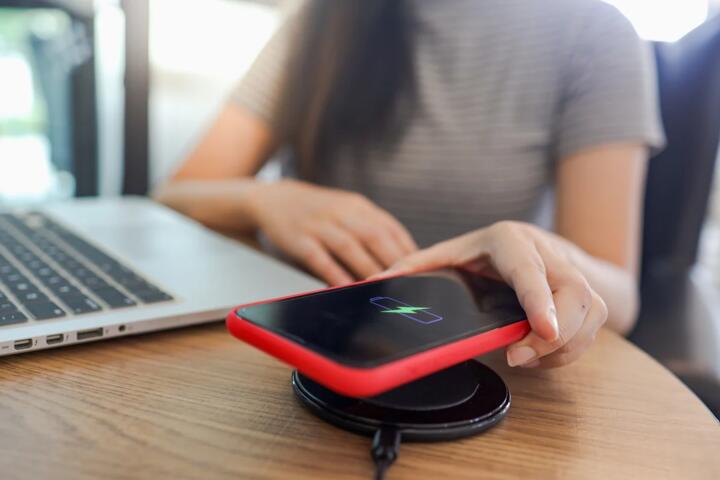
Heat is the most consistent lever you can control. Avoid charging under a pillow, in direct sun, or in a car dashboard area where temperatures climb quickly. If the phone feels warm to the touch during charging, pause charging for 10–20 minutes and resume when it cools. Wireless charging often increases surface temperature; if you care about battery longevity, wired charging at moderate power usually runs cooler.
Use the phone’s built-in charging safeguards. Many devices include temperature-aware charging limits that reduce current when the battery is hot. If you see a “charging paused” message, it reflects thermal protection logic rather than a random glitch.
Keep Charge In A Middle Band
Instead of aiming for frequent full charges, aim for a middle band when practical. A common rule of thumb is to avoid long periods at 100% and avoid deep discharges below roughly 20% when you can. If you need the phone at 100% for a trip, charge shortly before departure rather than leaving it full for hours. On iPhone, “Optimized Battery Charging” delays full charge until near your usual wake time; on Android, similar features may be labeled “Adaptive Charging” or “Protect Battery.”
Realistic outcome: shifting from “always full overnight” to “mostly 30–80% with delayed full charge” can reduce heat and high-state-of-charge time, which typically slows capacity loss. The exact benefit varies by climate, phone model, and charging power.
Use Cycles Wisely, Not Perfectly
Cycle count is a cumulative measure, so the goal is not to chase a low number. The more useful approach is to reduce stressful cycles: avoid charging while the phone is hot, avoid repeated fast-charge sessions in warm conditions, and avoid running high-power apps during charging when the battery is already warm. If you need fast charging, use it when the phone is cool and stop once you reach the needed level.
Practical method: do a “cool-down charge” routine. If you finish a gaming session or navigation run, let the phone cool for a few minutes before plugging in. That small delay can reduce the temperature spike that otherwise repeats across many days.
Interpret Health Reports Correctly
Use the reported maximum capacity or battery health percentage as a trend, not a verdict. Check the number every few weeks, then compare it with observed behavior like runtime and shutdowns. If the percentage drops sharply after a firmware update, treat it as a reporting change until the estimate stabilizes across several charge cycles.
Tools can help with context. On Android, apps like AccuBattery can estimate battery wear by tracking charge/discharge behavior, but they depend on calibration and can be noisy. On iPhone, the built-in maximum capacity percentage is more consistent for trend tracking, though it still reflects an estimate rather than a lab measurement.
Educational Case Examples
Case: Overnight Full Charge
A commuter charges an iPhone to 100% every night using a fast charger. The phone sits on a desk near a window where afternoon temperatures run warm. After about 10 months, maximum capacity drops from the high-90s to the low-90s, and runtime shortens during 5G use. The commuter switches to optimized charging and moves the charger away from direct sun, then keeps typical daily charge between about 40% and 85%.
After another 3–4 months, the maximum capacity still declines, but the rate slows and the phone no longer shuts down unexpectedly at around 10–15% during navigation. The improvement aligns with reduced high-state-of-charge time and lower charging temperatures, not with a sudden “repair.”
Case: Wireless Charging In Heat
A user relies on a car mount with wireless charging and keeps the phone in direct sunlight while driving. The phone feels hot during charging, and battery health percentage shows a noticeable decline over a year. The user changes to wired charging with a cooler mounting location and stops wireless charging during the hottest part of the day. They also avoid charging immediately after long camera recording sessions.
Runtime improves first, then battery health trend stabilizes. The key change is thermal exposure during charging, which affects both capacity loss and internal resistance growth.
Battery Health Checklist
Use this decision support to interpret what you see and what to do next.
| Observation | Likely Cause | What To Check | Next Step |
|---|---|---|---|
| Max capacity drops over weeks | Capacity loss from aging | Trend vs one-off changes; heat exposure | Reduce heat and high-charge time; track again |
| Runtime drops but capacity % stable | Higher power use or throttling | Battery usage stats; app behavior; signal strength | Adjust settings; update apps; retest |
| Shutdowns at higher % | Voltage sag from resistance growth | Does it happen under load? Charging temperature? | Stop stressing battery; consider service if persistent |
| Battery health % jumps after update | Reporting model change | Compare across several charge cycles | Treat as temporary; focus on behavior |
Step-by-step checklist for the next 14 days:
- Record current maximum capacity (or battery health %) and note typical daily runtime.
- Charge in a cool place and avoid charging when the phone feels hot.
- Use a middle band when possible; delay full charge until near use time.
- Note whether shutdowns or rapid drops happen under specific loads like navigation or camera.
- After 10–14 days, compare runtime and charging behavior before changing more variables.
Common Mistakes That Skew Results
One mistake is “calibration chasing,” where users repeatedly drain to 0% and charge to 100% to force the phone to learn. Modern battery gauges do not require frequent full cycles for accurate day-to-day estimation, and repeated deep discharges add stress. If you want a calibration check, do it rarely and only when the battery gauge behavior becomes clearly inconsistent.
Another mistake is treating a single number as proof. A battery health percentage can fluctuate due to temperature and recent usage. If you check right after a heavy gaming session or right after a long idle period, the estimate may not reflect the same conditions as the previous reading.
People also over-focus on cycle count while ignoring heat. A phone can accumulate cycles while staying cool and still age slowly; a phone can age faster with fewer cycles if it spends long periods hot at high charge. That’s why two users with similar cycle counts can report different runtime after the same time span.
Finally, some users rely on third-party apps without understanding their limits. Apps that estimate wear often need consistent charging patterns and may show optimistic or pessimistic numbers. I’ve seen AccuBattery-style estimates swing when the phone is charged in short bursts, because the app’s model depends on observed charge behavior rather than direct internal chemistry measurement.
FAQ
What Does Cycle Count Mean?
Cycle count represents cumulative charge movement equivalent to using 100% of the battery capacity, not necessarily one full charge from 0% to 100%. Phone manufacturers estimate it from charging and discharging history, so the number is a model-based proxy.
Is Maximum Capacity The Same As Health?
Maximum capacity is an estimate of how much energy the battery can store compared with when it was new. Battery health also includes resistance and voltage behavior, which can affect performance even when the capacity percentage changes slowly.
How Fast Does A Battery Degrade?
Degradation speed varies by temperature exposure, time spent near full charge, charging power, and usage load. Many phones show noticeable capacity loss over a year, but the rate differs widely across climates and habits.
Does Fast Charging Always Hurt Batteries?
Fast charging can increase temperature, which accelerates aging when the battery stays warm. Phones usually reduce charging current near full charge and use thermal protection, so the impact depends on heat conditions and how often fast charging occurs while the phone is already hot.
When Should I Replace The Battery?
Consider service when you see persistent shutdowns under load, major runtime loss compared with your normal usage, or a sustained drop in maximum capacity alongside real-world problems. If the phone is under warranty or covered by a service plan, check those terms first.
Author's Insight
Battery health reporting is an estimate built from voltage and temperature behavior, so the most reliable approach is trend tracking plus behavior checks. Capacity percentage helps interpret long-term aging, while runtime changes can also reflect app power use, signal strength, and thermal throttling. Heat management and reducing time near full charge usually reduce the stress that drives both capacity loss and internal resistance growth. If you want a practical baseline, record maximum capacity and typical runtime, then change one variable at a time for two weeks.
Key Takeaways
- Cycle count and maximum capacity describe different proxies; compare trends, not single readings.
- Temperature exposure during charging and high-state-of-charge time often drive faster degradation than cycle count alone.
- Runtime drops can come from power-hungry apps or throttling, not only from capacity loss.
- Use a middle charge band, charge in cooler conditions, and delay full charge until near use time when the phone supports it.
- When health numbers and real-world symptoms both worsen, consider service rather than repeated “calibration” cycles.