WLTP Range And Real Life
WLTP range is a lab-based estimate produced under defined test cycles, not a prediction of your next commute. The test uses controlled speeds, temperature conditions, vehicle mass, and accessory loads, then converts measured energy consumption into a distance figure. Real-world range changes when your driving pattern, climate, road elevation, and vehicle setup differ from the test assumptions. For example, a short trip with frequent acceleration and braking can consume more energy per kilometer than a steady cruise at the same average speed. If you drive at 120 km/h on a motorway, wind drag and rolling resistance usually dominate, and the gap versus WLTP often widens.
WLTP also reports different range values depending on the vehicle configuration and test category, so two trims can show different headline numbers even when the battery capacity looks similar. The conversion from energy use to distance depends on how the vehicle manages battery temperature and power limits during the test. In real use, battery preconditioning, thermal management strategy, and driver demand interact, and the vehicle may limit power when the battery is cold or hot. That interaction can make range feel inconsistent across mornings, evenings, and seasons.
Why Real Range Misses WLTP
People often treat WLTP as a direct “miles per charge” promise, then blame the car when the estimate drops. The mismatch usually comes from a few repeatable dependencies: speed profile, ambient temperature, vehicle load, tire choice, and auxiliary power draw. WLTP cycles include a mix of urban and extra-urban behavior, but your local roads may be more stop-and-go, more hilly, or more motorway-heavy. Even small changes in average speed can shift energy use because aerodynamic drag rises roughly with the square of speed.
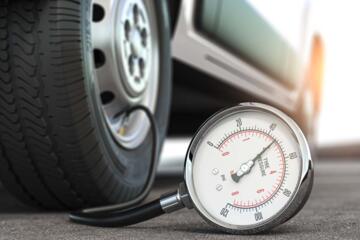
Temperature is another common driver of lower real-world range. Cold batteries reduce available power and can increase losses in charging and discharging, while cabin heating adds energy draw. In many climates, the first 10–20 minutes of driving matter disproportionately because the battery and cabin start from a lower temperature. Tire pressure also matters; underinflation increases rolling resistance, and the effect shows up as higher Wh/km. I once compared two sets of winter tires on the same EV during a January week (firmware version noted in the car’s energy screen, 2024.11), and the difference in consumption was visible within a few days of similar routes—annoying, but measurable.
Supporting technologies influence the outcome even when the battery size stays the same. Regenerative braking strength, brake blending strategy, and traction control behavior affect how much energy you recover on deceleration. Driver-assistance features can change speed and following distance, which changes the energy profile. Heat pump systems can reduce cabin heating energy in moderate cold, while resistive heating can raise consumption in colder conditions. The vehicle’s software may also adjust power limits based on battery temperature, which can change how quickly you reach cruising speed and how often you request high power.
How To Estimate Your Usable Range
Start With Your Typical Route
Use your own driving data instead of a single WLTP number. Pick a route you repeat often, then measure energy consumption over several trips to average out traffic variation. Many EVs show consumption in Wh/km or kWh/100 km; if your display uses a different unit, convert consistently. A practical target is to compare your average Wh/km to the vehicle’s WLTP Wh/km equivalent, then apply a correction factor for your speed and temperature. If you do not have historical data yet, run a 3–5 day baseline with steady habits and note outside temperature ranges.
Adjust For Speed, Weather, And Load
Plan for a range reduction when you drive faster than the test cycle’s typical speeds. Motorway driving at higher speeds tends to increase energy use through aerodynamic drag, and the effect can be large enough to change whether you arrive with a buffer. For weather, treat cold mornings as a separate scenario from mild afternoons. Cabin heating settings matter; using seat heating and steering wheel heating can reduce the need for high cabin air temperature. Vehicle load also changes consumption; carrying extra passengers or luggage increases mass and can raise energy use on hills.
Account For Charging And Buffer
Real trips rarely end at 0% battery, and charging stops rarely happen at a single fixed state of charge. Plan with a buffer because charging power often tapers as the battery approaches higher charge levels, and because you may need extra energy for detours or traffic. A common planning approach is to treat the “usable” battery as less than the advertised capacity due to reserve buffers and charging limits. If your route includes fast charging, check the charging curve in the vehicle’s documentation or charging provider app, since the time you save depends on how long you stay in the high-power window.
Use Tools That Track Energy Over Time
Use the vehicle’s energy history, then cross-check with a charging log if available. Some owners export data from the car’s app, while others rely on built-in trip summaries; both approaches work if you keep units consistent. If you track consumption, note tire type and pressure changes, because those can shift your baseline. A small frustration: many dashboards smooth data, so you may need to look at trip-level numbers rather than a long-term average to see what changed after a tire swap.
Case Examples For Decision Making
Scenario 1: City commuter with winter mornings. A driver commutes 18 km each way with frequent traffic lights and a short hill segment. In summer, the EV averages around 165 Wh/km on the route, and the WLTP headline feels close. In January, the same route averages closer to 210–230 Wh/km, and the driver arrives with less buffer even though the distance stays constant. The driver checks tire pressure, confirms cabin heating usage, and compares two weeks of data before changing habits. The outcome is not “the car is wrong,” but “the energy model changed with temperature and heating demand.”
Scenario 2: Road trip with motorway speed. A family plans a 320 km trip using a mix of urban roads and 140 km/h motorway segments. The EV’s WLTP range suggests a single charge might be possible, but the driver targets a stop earlier to protect arrival buffer. During the trip, consumption spikes on the motorway portion, and the driver notices that arriving with a low state of charge triggers slower charging and more conservative power limits. The driver adjusts by charging to a mid-range state of charge at the first stop, then continuing. The lesson is that WLTP can still be useful for comparison, while trip planning needs speed-aware buffers.
WLTP Vs Real World Checklist
| Factor | What WLTP Assumes | What Changes In Real Use | What To Do |
|---|---|---|---|
| Speed profile | Defined cycle speeds and accelerations | Motorway cruising and aggressive driving raise Wh/km | Compare your average speed and plan a buffer for fast segments |
| Temperature | Test conditions set by the standard | Cold reduces battery efficiency; heating adds load | Track winter trip consumption separately from summer |
| Tires and pressure | Specific tire setup used in testing | Winter tires and low pressure increase rolling resistance | Check pressure monthly and note tire model changes |
| Load and route | Vehicle mass and route profile fixed in test | Passengers, luggage, and hills raise energy demand | Use your route history and adjust for elevation changes |
| Charging behavior | Not a direct part of WLTP range | Charging power tapers; reserves reduce usable energy | Plan stops with a mid-charge target and a time buffer |
Step-by-step planning checklist:
- Write down your typical Wh/km from the last 3–6 weeks, or run a short baseline if you are new to the EV.
- Split your data by season: mild weather vs cold mornings.
- For trips, estimate energy as distance × your Wh/km, then subtract a reserve for detours and speed changes.
- For fast charging, plan to arrive with enough charge to stay in the higher-power window, then charge to a mid-range state rather than pushing to the top.
- After the first real trip, compare predicted vs actual consumption and update your assumptions.
Common Mistakes Buyers Make
One mistake is comparing WLTP numbers across vehicles without checking trim and tire configuration. Some cars offer different wheel sizes and tire types that can change consumption, and WLTP values may correspond to a specific configuration. Another mistake is ignoring the difference between range and charging time. A car can show a respectable WLTP range but still require more time on a route if the charging curve tapers early.
People also over-trust the car’s estimated remaining range at the start of a trip. Many vehicles update the estimate based on recent driving, so a calm neighborhood drive can make the estimate optimistic, while a sudden motorway segment can make it pessimistic. A third mistake is treating “eco mode” as a magic switch. Eco mode changes throttle mapping, HVAC behavior, and regen settings, but it cannot remove physics like wind drag at high speed.
Finally, some buyers plan trips using the maximum WLTP range figure instead of a realistic usable buffer. That approach can work on paper for a single route, then fail when traffic, weather, or roadworks shift the energy demand. If you want fewer surprises, plan with a conservative reserve and verify it with at least one real-world test drive on your own roads.
FAQ
Is WLTP Range Measured In Winter?
WLTP uses defined test conditions, and the exact temperature setup depends on the test procedure and reporting format. Real winter driving often adds cabin heating energy and increases battery losses, so winter consumption can exceed WLTP even when the car’s thermal system performs well.
Why Does Speed Change EV Range So Much?
Higher speed increases aerodynamic drag, which grows rapidly with speed, and it raises energy use even if acceleration patterns stay calm. Rolling resistance also rises with speed and tire condition, so motorway driving can consume more energy per kilometer than urban driving.
How Should I Compare Two EVs?
Compare the same type of WLTP figure for the same trim and wheel/tire configuration, then look for published energy consumption units like kWh/100 km if available. Use your route data to estimate Wh/km and apply a buffer for temperature and speed.
Does Tire Pressure Affect Range?
Underinflation increases rolling resistance, which increases Wh/km. The effect varies by tire model and temperature, so the best approach is to track consumption before and after pressure changes rather than relying on a single generic percentage.
Can Preconditioning Improve Real Range?
Battery and cabin preconditioning can reduce energy losses by warming the battery and cabin before departure, which helps in cold conditions. The benefit depends on whether preconditioning uses grid power before you leave and on the vehicle’s thermal strategy.
Author's Insight
WLTP range is a standardized energy-to-distance estimate built from controlled driving cycles and test assumptions. Real-world range varies because energy demand depends on speed, temperature, tires, load, and route elevation, and those factors change the vehicle’s Wh/km. The most reliable method for planning is to measure your own consumption over multiple trips and then apply a conservative buffer for season and speed. If you track Wh/km and charging behavior, you can turn a headline range number into a practical estimate for your routes.
Key Takeaways
- WLTP range supports comparison across vehicles, not a guaranteed distance for your specific trip.
- Speed and cold weather often create the largest gaps through aerodynamic drag, heating load, and battery efficiency changes.
- Use your own Wh/km data by season, then plan trips with a reserve and charging buffers.
- Check trim and tire configuration when comparing cars, since wheel and tire choices can shift consumption.