EV Battery SoH Basics
Battery State of Health (SoH) estimates how much energy a lithium-ion EV pack can store compared with when it was new, usually expressed as a percentage. A common marketing phrase is “80% capacity,” which typically means the pack’s measured usable capacity is about 80% of the original reference capacity, not that the car will deliver 80% of its original range in every situation.
Two evidence-based facts anchor the interpretation. First, lithium-ion capacity fades with cycling and calendar aging, and the rate depends strongly on temperature and time at high state of charge; studies and OEM test protocols consistently show faster degradation when packs spend long periods hot and near full charge. Second, many EV warranties use a capacity threshold tied to a defined test procedure, often around 70–80% retained capacity after a set mileage and time window, such as 8 years/100,000–160,000 km depending on region and model.
In practice, “capacity” in SoH is not the same as “range.” Range depends on energy consumption (Wh/km), which changes with speed, HVAC load, tire pressure, and battery temperature. For example, a 10–15% drop in usable capacity can translate to a smaller or larger range change depending on whether the car is operating in a cold climate where power limits and heating draw more energy.
Measurement method also matters. Many cars estimate SoH from model-based battery management system (BMS) calculations using voltage, current, temperature, and sometimes reference points after specific driving or charging patterns; the estimate can drift if the pack has not been observed under the conditions the algorithm expects. I’ve seen owners compare two “SoH” readings from different apps on the same day, and the numbers differ because the apps rely on different scaling assumptions and data sources.
Why 80% Gets Misread
People often treat SoH as a direct, stable number that maps to a fixed range loss, but SoH is an estimate with dependencies. The BMS may infer capacity from partial data, and the inference accuracy depends on whether the pack has reached certain voltage regions and whether temperature has been within the algorithm’s calibration range.
One common mistake is assuming that “80%” means the battery is halfway to failure. Lithium-ion degradation is not linear; the slope can change over time as internal resistance rises and the BMS adjusts how it limits power. A pack at 80% capacity can still deliver strong performance if resistance growth is modest, while another pack at the same capacity can feel weaker due to higher internal resistance and more aggressive power limiting under cold conditions.
Biological mechanisms are not relevant here because EV batteries do not involve living tissue. The closest “mechanism” analogy is electrochemical: capacity loss comes from loss of lithium inventory (for example, growth of the solid-electrolyte interphase) and from structural changes that reduce the active material’s ability to store charge. Resistance growth changes how much voltage sag occurs under load, which affects usable power and perceived acceleration, even when capacity percentage looks similar.
Real-world situations create measurement bias. A pack that spends months at 100% state of charge can show faster calendar aging, yet the SoH display might not immediately reflect the long-term loss if the BMS has not re-anchored its capacity model. Conversely, a pack that was recently driven hard and then charged to high state of charge can trigger a recalibration event that shifts the displayed SoH, which feels like “the battery suddenly improved,” even though the underlying aging did not reverse.
Supporting technologies also shape the number. Thermal management, cell chemistry, pack design (series/parallel configuration), and the BMS’s estimation strategy all influence how SoH is computed and reported. Even within the same model, firmware updates can change the estimation behavior; a minor change in BMS logic can move the displayed SoH by a few percentage points without any physical recovery.
How To Interpret SoH Reports
Separate Capacity From Range
Use “80% capacity” as an indicator of stored energy, not a direct range multiplier. To estimate range impact, compare your recent Wh/km (or kWh/100 km) to earlier driving under similar conditions, then apply the capacity change as a rough upper bound. In cold weather, range can drop more than capacity because heating and power limits consume extra energy.
In practice, look for a pattern: if your Wh/km rises by 20% due to winter driving and the SoH drops by 10%, the range change will reflect both effects. A mild aside: I’ve noticed owners who track range but ignore tire pressure; a 0.5 bar underinflation can add drag and raise consumption, which confuses the SoH interpretation.
Check The Test Definition
Warranty and capacity claims depend on a defined test procedure, not just a dashboard number. Read the warranty terms for the exact retained-capacity threshold and how it is measured (for example, whether it uses a standardized capacity test at a specific temperature and charge/discharge rate). If the warranty uses a specific method, the displayed SoH may not match it at any given moment.
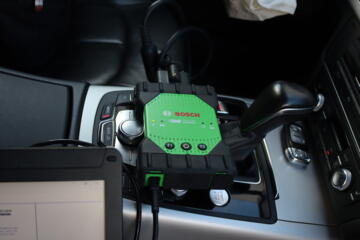
When you compare “80%” across sources, confirm whether the figure is from the OEM BMS, a service diagnostic tool, or a third-party app. Third-party tools often infer SoH from limited signals and may apply different scaling, which can produce optimistic or pessimistic readings.
Account For Temperature And SoC
SoH estimates are sensitive to temperature history because cell voltage behavior and internal resistance vary with temperature. A pack that has been kept warm and charged frequently near 100% state of charge tends to age faster, while moderate temperatures and avoiding long periods at full charge tend to slow degradation.
For practical interpretation, compare SoH readings taken after similar thermal conditions. If one reading was recorded after a long highway drive in winter and another after a short trip in summer, the SoH estimate may shift due to measurement conditions rather than true aging.
Look At Power Limits And Resistance
Capacity percentage does not describe how the car will behave under load. If you notice stronger-than-usual voltage sag, reduced acceleration, or earlier power limiting during fast charging or cold starts, internal resistance growth may be the dominant factor.
In practice, check whether the car’s charging curve changes: slower peak charge rates or longer time to reach a given state of charge can reflect resistance growth. Many EVs also show battery temperature and charging power; use those numbers to separate “battery health” from “thermal management strategy.”
Use Consistent Measurement Windows
SoH estimates improve when the BMS has observed the pack across a representative operating window. To reduce noise, compare SoH values after similar driving and charging patterns, and avoid comparing a fresh post-charge reading to a reading taken after days of sitting at a different temperature.
A practical method is to record SoH alongside odometer, ambient temperature, and whether the car was charged to 80% or 100%. I’ve used a simple spreadsheet (I started with Google Sheets in 2024) to track these variables, and the trend lines become clearer once you stop mixing winter and summer data.
Plan Charging For Slower Degradation
Charging habits affect aging rate, even when the SoH display lags behind. For daily use, many owners choose a lower charge limit such as 70–90% to reduce time spent at high state of charge, while reserving 100% for trips that require it. Fast charging can also contribute to aging due to heat and current stress, so frequent high-power sessions can accelerate degradation compared with slower charging.
Use realistic outcomes rather than guarantees: reducing time at high state of charge and moderating fast-charging frequency tends to slow capacity fade, but the exact benefit varies by chemistry, thermal management, and ambient conditions. If your car supports scheduled charging, set it so the battery reaches the target charge close to departure time rather than hours earlier.
Interpret Firmware And App Differences
Firmware updates can change how the BMS estimates SoH. If you see a step change after a software update, treat it as a measurement-model change until you confirm the trend over subsequent weeks.
Third-party apps can also differ because they may read different signals or apply different calibration curves. If two tools disagree by 5–10 percentage points, the safest approach is to treat both as directional indicators and focus on trend consistency rather than the absolute number.
Educational Case Examples
Scenario A: A commuter EV shows “80% capacity” at 90,000 km. The owner lives in a mild climate, charges to 90% most days, and fast-charges once per week. The car’s winter range drops more than summer range, and the owner initially blames the 80% number. After tracking Wh/km and battery temperature, the owner finds winter consumption is about 25% higher due to HVAC and lower efficiency, while the SoH trend stays stable over 3 months, suggesting the 80% figure reflects capacity fade rather than a sudden failure.
Scenario B: A second owner sees SoH fall from 92% to 85% after a period of frequent 100% charging and repeated fast-charge sessions. The dashboard SoH estimate changes quickly, which feels alarming. A service appointment reveals that the BMS model recalibrated after a specific charging pattern, and the resistance indicators also show higher internal resistance. The owner switches to an 80% daily limit and reduces fast charging frequency; over the next 2–3 months, the SoH estimate continues to drift downward but at a slower pace, consistent with reduced stress.
SoH Checklist And Comparison
| What You See | Likely Meaning | What To Check Next | Decision Use |
|---|---|---|---|
| “80% capacity” | Estimated retained capacity vs new reference | Warranty test definition, temperature history, and trend over time | Plan range expectations and charging limits |
| SoH drops after update | Measurement-model change possible | Compare multiple readings across weeks; check firmware version | Avoid panic; verify trend |
| Range drops faster than SoH | Consumption change dominates (weather, tires, HVAC) | Track Wh/km and battery temperature; check tire pressure | Adjust driving and maintenance |
| Fast-charge slows early | Resistance growth or thermal limits | Compare charging power vs temperature; review recent fast-charge frequency | Assess usability for your routine |
Step-by-step checklist:
- Record SoH, odometer, ambient temperature, and whether the car was charged to 80% or 100% within the last 24 hours.
- Compare range using Wh/km from a consistent route, not a single trip.
- Check whether the car shows reduced peak charging power or earlier power limiting under cold conditions.
- Read the warranty terms for the retained-capacity threshold and measurement method.
- Track the SoH trend for at least 4–8 weeks before concluding the battery is deteriorating unusually fast.
Common Mistakes To Avoid
Buying or selling decisions often hinge on a single SoH snapshot. A one-day change can reflect recalibration, temperature, or charging pattern rather than true aging, and it rarely works the way the dashboard label implies.
Another mistake is ignoring the difference between “capacity” and “health symptoms.” A pack can show a moderate capacity number while still feeling limited due to resistance growth, and the reverse also happens when capacity fades but power limits remain manageable.
Some owners chase a higher SoH number by changing charging behavior in ways that increase stress. For example, repeatedly charging to 100% to “prove” the battery is healthy can increase calendar aging, which can worsen the long-term trend even if the estimate looks better temporarily.
People also confuse third-party app SoH with OEM diagnostics. If you plan to use SoH for warranty discussions, request the service diagnostic output that matches the warranty test definition, because the dashboard estimate can differ from the standardized measurement.
FAQ
Does 80% SoH mean 20% less range
No. SoH reflects retained capacity, while range depends on energy consumption (Wh/km), battery temperature, HVAC use, and power limits. In cold weather, range can drop more than capacity because heating and voltage limits consume extra energy.
Why does SoH change after charging
The BMS updates its model using voltage, current, and temperature data. After a charge that reaches certain voltage regions, the estimate can shift due to recalibration, even when the battery’s physical aging did not reverse.
Is 80% capacity a warranty failure
It depends on the specific warranty terms for your vehicle and region. Many warranties use a retained-capacity threshold around 70–80% measured under a defined test procedure, so the dashboard number alone cannot confirm coverage.
Can fast charging reduce SoH faster
Frequent high-power charging can increase aging rate because it raises heat and electrochemical stress. The effect varies with thermal management, charging power, and how often the pack is kept at high state of charge afterward.
How can I track SoH reliably
Record SoH with odometer, ambient temperature, and recent charge limit (for example, 80% vs 100%). Compare trends over weeks using consistent routes and avoid judging from a single reading after unusual weather or a long fast-charge session.
Author's Insight
“80% capacity” is best treated as a directional indicator of stored energy, not a precise range forecast. SoH estimates depend on BMS modeling, temperature history, and the conditions under which the pack is observed, so two readings can differ without any meaningful change in the battery’s chemistry.
Warranty thresholds matter because they tie to a defined retained-capacity measurement rather than the dashboard display. A practical approach is to combine SoH trend tracking with energy-consumption data (Wh/km) and charging behavior, then interpret changes in context.
If you want one small habit, track SoH alongside charge limit choices and ambient temperature; the pattern usually becomes clearer after several weeks, and it reduces the temptation to react to a single number.
Key Takeaways
- “80% capacity” refers to retained energy versus a new reference, not a fixed range multiplier.
- SoH estimates vary with temperature, state of charge, and BMS recalibration, so trend matters more than a single snapshot.
- Range depends on consumption (Wh/km) and HVAC load, which can change more than capacity in cold weather.
- Power limits and fast-charge behavior can reveal resistance growth even when capacity percentage looks moderate.
- Warranty coverage depends on the warranty’s retained-capacity threshold and test definition, not only the dashboard SoH.