Radiator Output by Temperature
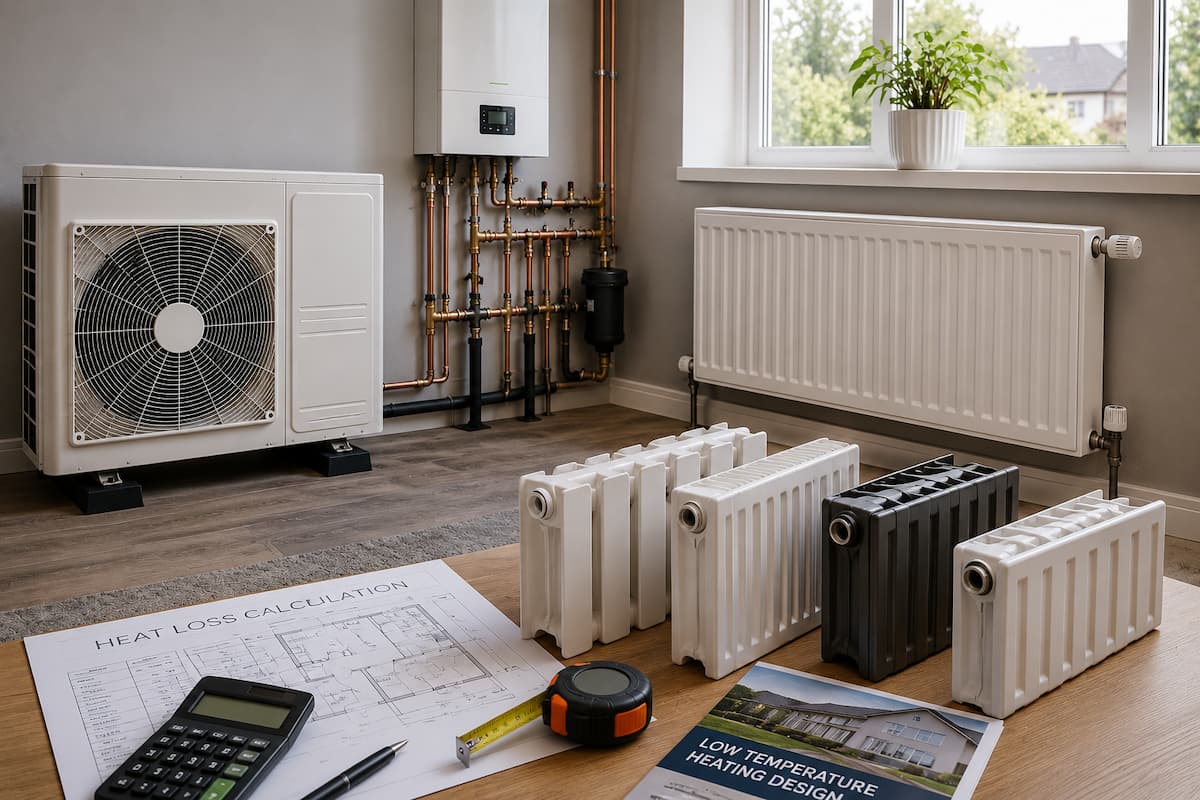
Radiator “output” usually refers to heat transferred from the radiator to the room under defined test conditions. In practice, the same radiator can feel very different depending on water temperature, flow rate, thermostat settings, and room heat losses. Most radiator ratings are published using a standardized temperature difference method, then converted to watts for a specific scenario. When you compare 45°C, 55°C, and 75°C, you are mainly changing the temperature difference that drives heat transfer, not just “turning up a dial.”
To make this concrete, consider a typical room at 20°C. If the radiator water is 45°C, the average radiator temperature might sit somewhere in the mid-40s, so the temperature difference is modest. At 55°C, the difference grows, and the radiator surface temperature rises enough that convection and radiation increase. At 75°C, the radiator runs much hotter, so heat transfer rises sharply, but comfort and efficiency trade off against higher losses in pipes and faster cycling. A small aside from troubleshooting: many people read the label as if it were a guaranteed real-world value, then wonder why their measured heat feels lower on a cold windy day.
Why People Misread Ratings
One common mistake is treating the radiator’s published wattage as a direct match to any operating temperature. Manufacturer data are usually based on a specific test method with defined inlet/outlet temperatures, room temperature, and sometimes a particular flow condition. Another mistake is ignoring that radiator output depends on the temperature difference between the radiator and the room, not on the water temperature alone. Two systems can both run “55°C” yet deliver different heat because one has higher flow, different pipe insulation, or a different control strategy.
Radiator type also matters. Panel radiators, convector-style radiators, and towel rails have different proportions of convection versus radiation, which changes how output scales with temperature difference. Thermostatic radiator valves (TRVs) can reduce flow when the room warms, so the radiator may not reach the assumed operating temperature. Even the plumbing layout matters: long uninsulated runs can steal heat before it reaches the radiator, and that heat loss does not warm the room. If you measure supply temperature at the boiler but the radiator receives cooler water due to mixing or throttling, the “45°C” or “55°C” label becomes a moving target.
How Temperature Changes Heat Transfer
Radiators transfer heat through convection and radiation. Both increase as the radiator surface temperature rises relative to the room. In many practical heating models, output scales with a power of the temperature difference rather than linearly. That means moving from 45°C to 55°C often produces a noticeable jump, while moving from 55°C to 75°C produces a larger jump again. The exact exponent varies by radiator design and test conditions, so any numeric estimate should be treated as an approximation.
A useful way to think about it is through the “mean water temperature” and the room temperature. Many rating systems use a mean temperature difference, often written as ΔT, between the mean radiator water temperature and the room. If the room is 20°C, then mean water temperatures of roughly 45°C, 55°C, and 75°C correspond to larger ΔT values as the water gets hotter. The radiator’s heat output then scales with ΔT raised to an exponent that is commonly around 1.3 for many radiator types in simplified models, though real systems can deviate. I’ve seen homeowners get closer to reality by using the same exponent consistently across comparisons, even if the absolute number still misses the mark.
Estimating Output at 45°C, 55°C, and 75°C
Use The Rating’s Temperature Basis
Start by finding the radiator’s published rating, often shown as watts at a specific test condition such as a mean water temperature of 75°C with a room temperature of 20°C. Many labels express this as a ΔT value (for example, ΔT=50°C). If your label states “output at ΔT=50,” you can scale from that baseline to other ΔT values. If the label uses a different room temperature or test method, you need to match those assumptions before scaling. A practical aside: some older radiators have labels that list only dimensions and a vague “heat output,” so you may need to look up the model number or consult the installer’s paperwork.
Scale by Temperature Difference
For a quick estimate, assume the room is 20°C and approximate the radiator mean water temperature as the setpoint you are using (real mean temperatures depend on flow and return). Compute ΔT for each case as (mean water temperature − room temperature). Then scale the rated watts by a power law using an exponent around 1.3 as a common engineering approximation for many radiators. Example with a baseline of 1000 W at ΔT=50: if ΔT at 45°C is about 25°C, the scaled output becomes 1000 × (25/50)^1.3, which is roughly 430 W. At 55°C (ΔT≈35°C), it becomes 1000 × (35/50)^1.3, roughly 650 W. At 75°C (ΔT≈55°C), it becomes 1000 × (55/50)^1.3, roughly 1,130 W. These numbers are illustrative; your radiator and system can land higher or lower.
Account for Flow, Valves, and Controls
Even if you set the boiler to 55°C, the radiator may not receive that temperature if TRVs throttle flow or if the system mixes water. Low flow reduces the effective heat transfer because the water spends less time in the radiator and the temperature drop across the radiator changes. In hydronic systems, flow is also tied to pump settings and balancing valves. If you want a more realistic estimate, measure the radiator inlet and outlet temperatures with a contact thermometer and note the room temperature. The mean radiator water temperature is then the average of inlet and outlet, which improves the ΔT calculation. If you do not have thermometers, you can still improve accuracy by checking whether the TRV is fully open during the test period.
Expect Real-World Deviations
Pipe losses, drafts, insulation quality, and window performance shift the room temperature and the heat demand. A radiator that “should” deliver 650 W on paper may deliver less if the room is colder than the assumed 20°C. Conversely, it may feel stronger if the room is warmer or if the radiator is in a low-loss location. Also, thermostats cycle the system, so the radiator may spend part of the time at lower temperatures than the setpoint. Mild frustration is common here: people compare a short “boost” period to a long steady state and then conclude the scaling is wrong. For better comparisons, observe output after the system reaches stable operation for long enough that the room temperature stops drifting.
Educational Case Examples
Case 1: Apartment with TRVs at 45°C. A tenant runs the heating with a boiler setpoint that yields about 45°C at the radiator inlet during the test window. The room sits near 19–20°C, and the TRV is partially closed because the room warms quickly near the radiator. The radiator feels underpowered, and the tenant notices that the radiator surface temperature rises slowly. Using the scaling approach, the expected output at ΔT≈25°C is roughly 40–50% of the label value at ΔT=50°C. The tenant’s observation matches the direction of the estimate, and the remaining gap likely comes from TRV throttling and the room not staying exactly at 20°C.
Case 2: House switching from 55°C to 75°C. A homeowner tests two modes on a cold day: one with radiator water around 55°C and another with around 75°C. The house has uninsulated pipe runs in a loft, and the homeowner sees that the “75°C” mode warms the rooms faster but also increases heat loss before the radiator. The scaling model predicts a larger jump in radiator output when moving to higher ΔT, so the faster warm-up makes sense. The homeowner also notices more cycling and a stronger temperature swing, which can happen when the system overshoots setpoints. The lesson is that higher radiator output does not automatically mean better comfort-per-energy, because distribution losses and control behavior change too.
Output Scaling Checklist
| Scenario | Approx ΔT (Room 20°C) | Relative Output* | What to Check |
|---|---|---|---|
| 45°C Water | ~25°C | ~0.43× | TRV opening, inlet/outlet temps |
| 55°C Water | ~35°C | ~0.65× | Room temp stability, pump settings |
| 75°C Water | ~55°C | ~1.13× | Pipe losses, cycling behavior |
*Relative output assumes a baseline of 1000 W at ΔT=50°C and uses a common radiator scaling exponent around 1.3. Your radiator label and system conditions can change the result.
Step-by-step checklist for a realistic estimate:
- Record room temperature during steady heating, not during the first few minutes.
- Measure radiator inlet and outlet temperatures if possible, then compute mean water temperature.
- Use the radiator’s published test condition (ΔT or mean water temperature and room temperature) as your baseline.
- Scale output using a consistent exponent across scenarios; treat the result as an estimate.
- Check TRV position and whether the radiator is partially throttled during the test.
- Compare the estimate to observed warm-up time and radiator surface temperature, not just thermostat readings.
Common Mistakes That Skew Results
People often compare temperatures at different points in the system. Boiler setpoint temperature does not equal radiator mean temperature when mixing valves, weather compensation, or TRVs are active. Another frequent error is using the room temperature at the thermostat location rather than the room’s average temperature where the radiator heats. Drafts and cold spots can keep the room heat demand higher than the assumed value.
Some readers also assume that “higher water temperature” always improves comfort in a predictable way. In reality, higher temperatures can increase cycling and overshoot when controls are tuned for a different operating regime. If you test 75°C for a short period and then test 55°C for a longer period, the comparison becomes misleading because the system and room thermal mass behave differently. Finally, many people forget that radiator output is only one part of the heating system; ventilation losses and heat leakage can dominate on poorly sealed buildings, so the radiator may not “catch up” even at higher temperatures.
FAQ
What does “radiator output” mean?
It refers to heat transferred from the radiator to the room under specified test conditions, usually expressed in watts at a defined mean water temperature and room temperature.
How do 45°C and 55°C compare in practice?
Output rises with the temperature difference between radiator and room, so 55°C typically delivers noticeably more heat than 45°C, often around 1.5× in common scaling approximations.
Why can a 75°C setting feel inefficient?
Higher water temperature increases radiator heat transfer but also increases heat losses in pipes and can cause faster cycling, which changes comfort and energy use.
Do TRVs change radiator output at the same setpoint?
Yes. TRVs can reduce flow through the radiator, lowering effective heat transfer even if the boiler or system setpoint stays the same.
How can I estimate output without lab equipment?
Use the radiator’s published rating condition, measure room temperature, and if possible measure radiator inlet and outlet temperatures to estimate mean water temperature and scale output with a consistent method.
Author's Insight
Radiator heat output depends on temperature difference, flow conditions, and the control strategy that governs how long and how steadily the radiator runs. Published wattage ratings come from standardized test conditions, so real homes deviate when room temperature, mean water temperature, and flow differ from the label assumptions. A practical approach is to treat 45°C, 55°C, and 75°C comparisons as temperature-difference scaling exercises, then adjust for TRV throttling and pipe losses. If you measure inlet and outlet temperatures, your estimate improves enough to guide decisions like whether to change radiator sizing, balancing, or operating temperature targets.
Key Takeaways
- Radiator output scales mainly with the temperature difference between radiator water and the room, not with water temperature alone.
- Using a consistent scaling method, 55°C typically delivers much more heat than 45°C, and 75°C delivers more again, but the exact factor depends on radiator design and system conditions.
- TRVs, flow rate, pipe losses, and room temperature stability often explain why real output differs from label values.
- For better estimates, measure radiator inlet/outlet temperatures and compare against the radiator’s published test condition.